
Twitter Analytics: Measure X Performance That Matters
Twitter analytics should help a business decide what to publish, where to invest, which audiences or formats deserve more attention, and whether activity on X is contributing to wider marketing outcomes. The platform is now branded X, but many teams still search for “twitter analytics” when they need to understand post performance, paid-campaign results, audience response or data that can be combined with web, CRM and sales reporting.
The practical choice is not simply whether to “use analytics”. It is whether native X Analytics is sufficient, whether a recurring export and spreadsheet can answer the question, or whether the organisation needs a governed BI workflow that joins X data to other sources. That decision depends on the objective, reporting frequency, attribution needs, data access, privacy constraints and the amount of maintenance the team can realistically own.
This guide is for founders, marketing leaders, analysts, ecommerce teams, agencies and enterprise functions deciding how far to take X measurement. It explains which metrics are useful, what the native tools can and cannot answer, when API or data-integration work becomes worthwhile, and when a data consultant can help turn fragmented social metrics into a reliable decision system.
Quick Answer: Start with the Decision, Then the Metric
Use native X Analytics when you need straightforward review of posts, media and campaigns. X describes its Post Activity Dashboard as a place to review impressions and interactions by post and export data to CSV, while its advertising measurement tools add campaign and conversion-oriented views.
Move to a spreadsheet or BI layer when the business question crosses systems—for example, “Which X content themes bring qualified website visitors?”, “Which campaigns create pipeline?”, or “How do paid and organic X results compare with other channels?” At that point, the difficult work is usually not chart design. It is metric definition, data matching, refresh reliability, attribution logic and ownership.
A useful rule: choose the lightest analytics setup that can support the decision repeatedly. If a weekly native export answers the question, a custom data pipeline is unnecessary. If decision-makers must reconcile X, website, CRM and revenue data every month, manual reporting may become the bigger risk.
Key Takeaways
- Define the outcome first: awareness, engagement, traffic, lead generation, customer response and paid conversion require different measures.
- Separate platform activity from business impact: impressions, likes and reposts describe behaviour on X; they do not automatically prove commercial value.
- Use native analytics before custom engineering: many teams can make good content decisions using X Analytics and structured exports.
- Integrate only for a real decision need: BI becomes valuable when X data must be compared with web, CRM, ecommerce, finance or cross-channel media data.
- Keep metric definitions explicit: distinguish public, organic, promoted and non-public measures and document calculation rules.
- Design for maintainability: API-based reporting needs authentication, monitoring, schema checks and ownership when platform conditions change.
- Measure learning, not vanity: a useful analytics process changes content, spend or customer-journey decisions and records what happened afterwards.
Table of Contents
- Define what X must achieve
- Choose metrics that match the objective
- Compare analytics setup options
- Plan data access and integration
- Connect X activity to business outcomes
- Build a repeatable reporting workflow
- Estimate effort, cost and maintenance
- Apply the model to real situations
- Decide when specialist support helps
- Summary
Define What X Must Achieve for the Business
A measurement plan should begin with a decision statement. “Improve our Twitter analytics” is not specific enough. “Identify which content themes create qualified visits to product pages” is better because it tells the team what data needs to be connected and what action could follow.
Map objectives to observable evidence
For brand awareness, the organisation may focus on exposure, video consumption and audience growth trends. For community or thought leadership, replies, reposts, mentions, profile activity and repeated engagement may be more useful. For demand generation, link activity only becomes meaningful when it is connected to landing-page behaviour, lead quality or downstream sales stages.
Paid campaigns need an additional distinction: delivery and engagement metrics tell you what happened on X, while conversion measurement helps relate advertising activity to actions beyond the platform. X’s current advertising measurement overview describes campaign performance measures and options such as website conversion tracking.
Decide what will change after review
Every recurring metric should have a possible decision attached to it. If video completion drops, the team might test shorter openings. If high-engagement posts do not generate qualified visits, the content objective may be community growth rather than demand generation. If paid clicks increase but conversion quality falls, the next action could involve targeting, landing-page experience or offer design rather than more social content.
Choose Twitter Analytics Metrics by Objective
There is no single “best” social metric. The useful set changes with the business question, and the same number can mean different things depending on whether a post was organic, promoted, video-led, link-led or designed for conversation.
Core organic and content measures
- Impressions or views: useful for exposure trends, but repeat viewing can mean the count is not a unique audience.
- Replies, reposts, likes and quotes: useful for comparing audience response by content theme and format.
- Engagement rate: useful only when the numerator and denominator are consistently defined across the comparison.
- Profile and link activity: useful when content is designed to move people toward a profile, website or next action.
- Video measures: view and completion behaviour can reveal where attention drops and which creative formats hold interest.
X’s current API metrics documentation distinguishes public, non-public, organic and promoted metric types and explains that access requirements vary by authentication and ownership. Treat those distinctions as data-model fields, not as implementation trivia, because mixing them can distort trend reporting.
Compare Native, Spreadsheet and BI Options
The right analytics setup depends on how many sources are involved, how often reporting is repeated, how much historical consistency matters and who needs to use the output. More technology is not automatically more mature.
| Option | Best fit | What it answers well | Internal requirement | Main limitation |
|---|---|---|---|---|
| Native X Analytics | Small teams and routine post review | Post, media and campaign performance inside X | Clear objectives and disciplined review cadence | Limited cross-channel business context |
| CSV export and spreadsheet | Regular analysis with modest data volume | Trend comparisons, content tagging and manual joins | Consistent export process and metric dictionary | Manual refreshes and formula drift |
| Third-party social tool | Multi-account or multi-platform operations | Unified publishing, listening and standard reporting | Tool governance, access management and configuration | Vendor-defined metrics may not match internal KPIs |
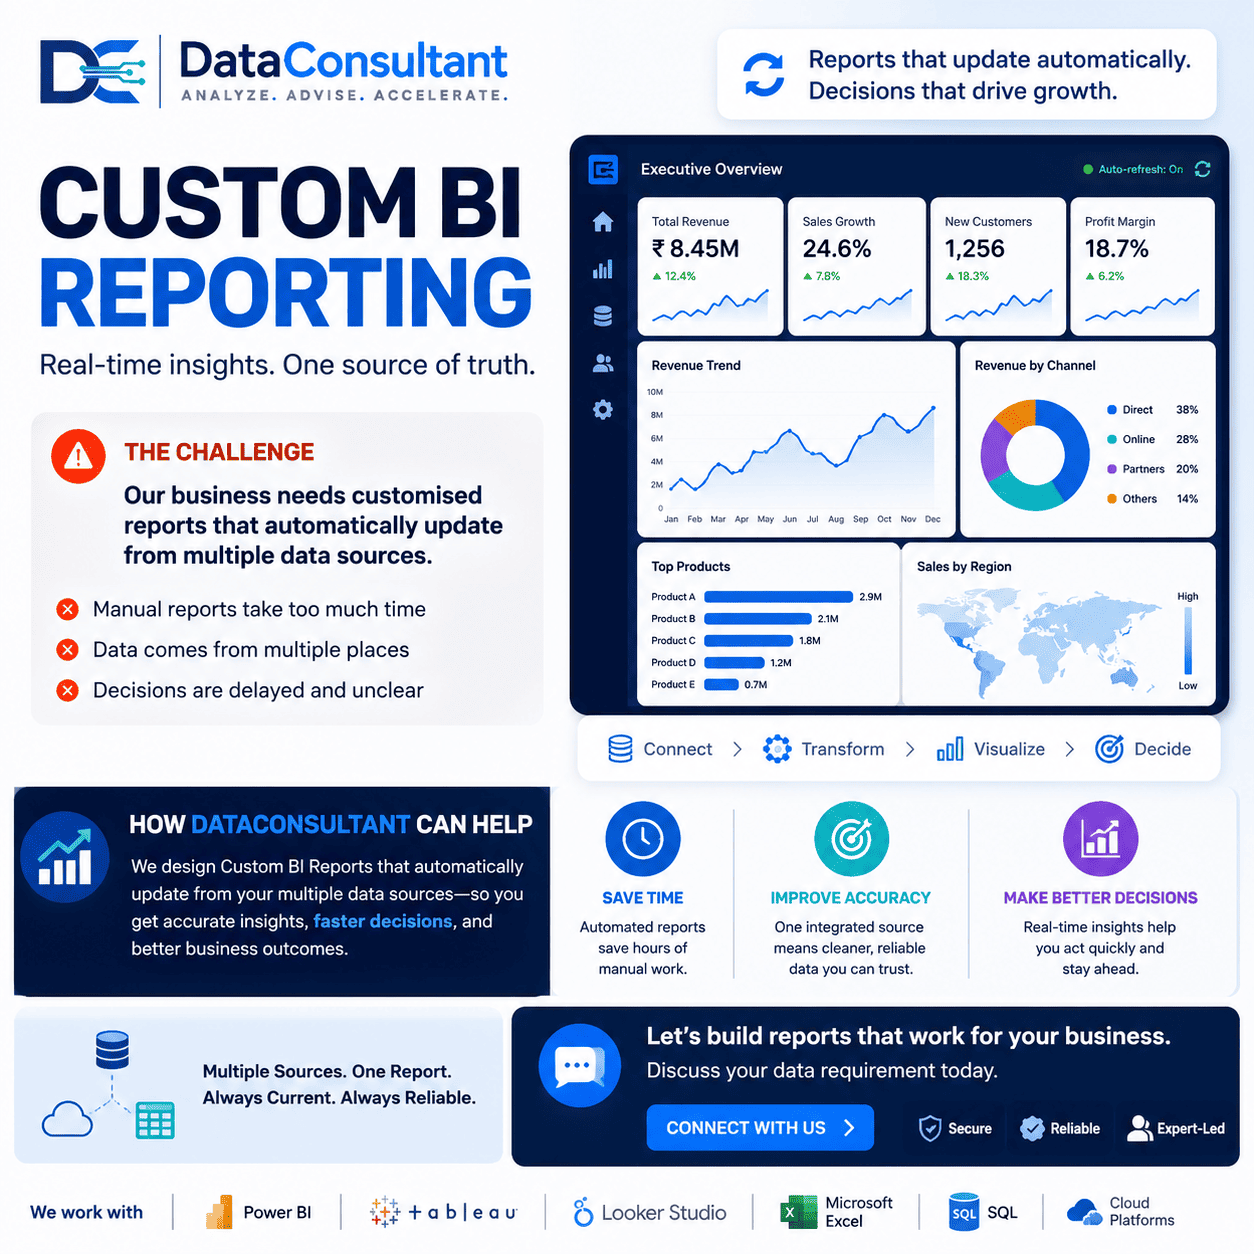
| Custom BI dashboard | Cross-channel management reporting | X plus web, CRM, ecommerce or revenue analysis | Data model, pipeline, QA and dashboard ownership | Higher build and maintenance effort |
| API-based analytics pipeline | Repeatable or specialised analysis at scale | Custom extraction, modelling and automation | Authentication, engineering and monitoring capability | Platform access and schema changes require upkeep |
A sensible progression is native reporting first, structured exports second, and automated integration only when repeated cross-system decisions justify the additional cost and operational dependency.
Plan Data Access, API Use and Governance
Deeper analytics requires more than permission to view an account. The team needs to know which metrics are available through the interface, which can be exported, which require API authentication, how far back data can be retrieved and whether the resulting data may be combined with other customer or campaign information.
Define the data model before the dashboard
A useful model normally separates account, post, media, campaign and date dimensions from measures such as impressions, engagements, clicks, views or conversion events. Add business-controlled fields such as campaign objective, content theme, product, market, funnel stage and owner. These fields make analysis more actionable than a flat export of platform numbers.
The current X developer documentation lists post fields such as public_metrics, organic_metrics, promoted_metrics and non_public_metrics, with some fields requiring user-context authentication. Confirm the current field definitions and access rules in the X API integration guide before designing a production pipeline.
Treat access and privacy as design inputs
Use least-privilege access for account credentials, API keys, exports and BI workspaces. Record who can retrieve data, who can change metric logic and who approves joins with CRM, customer or employee information. If social identifiers or behavioural data are linked to other datasets, the organisation should assess the applicable privacy basis, retention, transparency and security requirements rather than assuming public visibility removes those obligations.
Connect X Activity to Business Outcomes
The hardest part of twitter analytics is often the hand-off between a social action and an external business event. A link click may lead to a site visit, but the customer may return through another channel. A post may support brand recall without generating an immediate click. A paid campaign may be reported differently by the platform and by a web analytics tool because their attribution windows and counting rules differ.
Build an evidence chain instead of one magic KPI
For demand generation, a practical chain can be: post or campaign exposure → link interaction → landing-page session → qualified action → CRM stage → revenue outcome. Not every step will be observable for every user, and the organisation should not force certainty where the measurement design cannot support it.
For organic thought leadership, the evidence chain may be different: topic exposure → quality engagement → profile visits → repeated audience interaction → direct enquiries or assisted pipeline. The value of the analytics is the quality of the decision it informs, not whether every outcome can be attributed to a single post.
Watch for reconciliation gaps: X’s campaign measurement guidance notes that discrepancies can occur between X and third-party analytics. Document the counting rule, attribution window, timezone, filtering and data freshness used in each report before labelling one source “wrong”.
Build a Repeatable Twitter Analytics Workflow
A reliable workflow should make the same question answerable next week or next month without rebuilding the analysis from scratch. Start small, validate the definitions, and automate only after the manual logic is stable.
- Write the decision question. Define the audience, channel objective and action that could change.
- Create the metric dictionary. Record source, calculation, timezone, filters, organic/paid status and owner.
- Run a manual pilot. Use native dashboards or CSV files to prove the logic before engineering automation.
- Test data quality. Reconcile totals, duplicate handling, date ranges, missing records and source-system changes.
- Design the reporting view. Keep executive outcomes separate from diagnostic detail used by analysts.
- Set a review cadence. Assign owners for interpretation, actions and follow-up experiments.
- Automate selectively. Add APIs, ETL or BI refreshes only where recurring effort or risk makes automation worthwhile.
Estimate Cost, Effort and Ongoing Maintenance
There is no meaningful single price for twitter analytics because the scope can range from a native dashboard review to a cross-channel data product. Cost is driven by data access, number of accounts and markets, reporting frequency, history required, API or tool licensing, integration complexity, dashboard design, quality assurance, privacy review and the amount of support needed after launch.
Think in operating effort, not only licence price
- Native analytics: low tooling overhead, but manual interpretation and exports still consume staff time.
- Third-party tools: add subscription cost but may reduce publishing and reporting effort across platforms.
- Custom BI: adds discovery, modelling, integration, QA and dashboard work; value depends on whether it replaces repeated manual reconciliation or enables better decisions.
- API pipelines: require engineering ownership, credential management, monitoring and adaptation when platform access or data structures change.
Before commissioning a build, estimate the number of hours currently spent collecting and reconciling reports, the decisions delayed by missing context, and the risk of inconsistent numbers. Those factors are more useful than comparing software prices alone.
Practical Twitter Analytics Decisions
Example 1: Founder-led content
A B2B founder posts regularly and wants to know which themes support demand generation. Native X metrics can identify posts that earn response, but the business should tag content themes and connect link traffic to its website and CRM before claiming pipeline impact. A spreadsheet may be sufficient if volume is modest and the reporting cycle is monthly.
Example 2: Ecommerce paid campaigns
An ecommerce team uses X Ads and needs to compare cost and conversion performance with other paid channels. The right design is likely to combine campaign exports or conversion tracking with a consistent cross-channel KPI framework. The dashboard should preserve source-platform results while also applying one internal definition for metrics such as qualified conversion or contribution margin.
Example 3: Enterprise executive reporting
A large organisation has several X accounts, agencies and markets, each using slightly different engagement calculations. The first project should not be a new visual dashboard. It should be a KPI and data-governance exercise: agree metric definitions, account ownership, date logic, paid-versus-organic treatment and source controls, then automate the consolidated view.
Example 4: Social support and reputation
A service team wants to understand recurring customer themes in public conversations. That may require qualitative classification, not just counting likes or mentions. If the analysis stores handles, text, inferred categories or links social behaviour to customer records, privacy and access controls become part of the analytics design from the start.
Decide When Specialist Analytics Support Helps
External support is useful when the organisation has a decision problem that crosses marketing, data and technology boundaries. A short diagnostic may be enough when teams disagree on KPIs, reports do not reconcile, attribution is unclear or nobody knows whether native X data can answer the question. The output should be a scoped measurement model, source inventory, KPI dictionary and prioritised implementation roadmap—not simply another dashboard mock-up.
A defined project is appropriate when the team needs data integration, a governed semantic model, automated reporting, quality checks, executive dashboards and handover. DataConsultant can support this through data analytics consulting and, where reliable pipelines are required, data engineering support. Ongoing support or a managed team is justified only when campaign operations, source systems, reporting demand or platform integrations continue to change.
Internal staff or an existing social platform is usually sufficient when objectives are clear, reporting is simple, cross-system attribution is not required and the team can maintain a consistent review cadence. A consultant should reduce ambiguity or delivery burden, not create permanent dependency.
Summary: Use the Smallest Setup That Answers the Question
Twitter analytics is most useful when the organisation starts with a business decision and then chooses the minimum data needed to support it. Native X Analytics can be sufficient for content and campaign learning. Structured exports can support regular trend analysis. A custom BI or API workflow becomes appropriate when X data must be combined with web, CRM, ecommerce, finance or other channels and when manual reconciliation is too slow or inconsistent.
Before investing in a larger solution, validate the business goal, metric definitions, data quality, account and API access, governance boundaries and internal ownership. A short diagnostic is useful when those foundations are uncertain. A defined project is justified when integration, modelling, dashboards, documentation, quality assurance and handover can be scoped. Ongoing analytics support or a managed team makes sense when the reporting environment continues to change and there is a sustained workload.
If the scope is clear and the internal team can maintain it, keep the work in-house. If a software tool already provides the decision-ready evidence, use it. If the challenge is fragmented data, inconsistent KPIs or a repeatable cross-channel reporting need, specialist support can help establish a practical architecture and implementation plan.
Need a Twitter Analytics Diagnostic?
DataConsultant can help assess your current X reporting, KPI definitions, data sources, attribution requirements and integration readiness, then recommend whether a native workflow, defined analytics project or ongoing support is proportionate.
Explore Data Analytics SupportAt DataConsultant.in, we help organisations turn data and AI priorities into governed, reliable, and practical business capability.
FAQs About Twitter Analytics
What is twitter analytics?
Twitter analytics is the measurement of how content, audiences and campaigns perform on X, the platform formerly known as Twitter. For most teams, it combines native X Analytics with business context such as website traffic, leads, sales or support outcomes. The important step is to define the decision each metric should support before building dashboards.
Which twitter analytics metrics matter most for a business?
The useful metrics depend on the objective. Awareness teams may prioritise impressions, reach-related campaign measures and video views; engagement teams may examine replies, reposts, likes and engagement rate; demand-generation teams should connect link activity with website and conversion data. Avoid treating one universal engagement rate as proof of business impact.
Is X Analytics enough, or do we need a BI dashboard?
Native X Analytics is often enough for a small team that mainly needs post and campaign review. A BI dashboard becomes more useful when you must combine X with web analytics, CRM, ecommerce, paid-media or finance data, apply consistent KPI definitions, or automate recurring reporting. Build the integration only when those decisions justify the extra maintenance.
Can twitter analytics show which posts create sales?
It can contribute to that analysis, but post-level engagement alone does not prove a sale was caused by X. Use conversion tracking, tagged links, web analytics and CRM or ecommerce outcomes where appropriate, then compare the evidence across the customer journey. Attribution rules and consent choices can materially affect what can be measured.
How often should a business review twitter analytics?
Match review frequency to the decision cycle. Content teams may use a weekly review for creative learning, campaign owners may monitor active paid activity more frequently, and executives may need a monthly trend view. Avoid changing strategy after every post; use enough observations to distinguish a repeatable pattern from normal variation.
What data should we export from X for deeper analysis?
Start with post identifiers, timestamps, content attributes, impressions or views, engagement measures, link-related measures where available, media performance and campaign dimensions where relevant. Keep a data dictionary that records metric definitions and whether figures are public, organic, promoted or non-public. This prevents unlike metrics from being combined accidentally.
When is the X API useful for twitter analytics?
The X API is useful when a team needs repeatable extraction, larger-scale analysis, integration with other data or custom modelling that the native interface does not provide. Access depends on authentication, endpoint availability and the metric type. Confirm current X API access, retention and pricing conditions before designing a production pipeline.
How should privacy and governance be handled in social analytics?
Collect only the data needed for a defined business purpose, restrict access, document metric definitions and retention, and review whether personal or inferred data is being joined with other sources. Publicly visible social activity is not automatically risk-free to process. Apply the privacy, security and legal requirements relevant to your organisation and markets.
When should we use a data consultant for twitter analytics?
Use internal staff when the objective, data sources and reporting method are already clear. A short data-consulting diagnostic is useful when teams disagree about KPIs, exports do not reconcile, attribution is unclear or X data must be combined with other systems. A defined analytics project is justified when you need a governed data model, automated pipeline, dashboard and handover.
Who should own twitter analytics after implementation?
Business owners should own the decisions and KPI definitions, while marketing or analytics teams usually own day-to-day interpretation and reporting. Data or engineering teams may own automated integrations, and privacy or security teams should define relevant controls. External support should include documentation and knowledge transfer so ownership remains clear.