
How to Choose Data Visualization Tools
Data visualization tools should be chosen by the business decisions they must support, not by the number of chart types or AI features they advertise. Start by defining who will use the output, what action they need to take, which metrics must be trusted and how quickly the data must refresh. The main caution is to avoid treating a dashboard request as proof that the business problem is understood. Conflicting reports, unclear KPI ownership, inaccessible data or weak source-system processes are data-management problems before they are visualisation problems.
A practical evaluation therefore separates the need for software from the need for specialist support. Internal staff may be enough when requirements and data are clear. A tool purchase may be enough when the principal gap is functionality. A short diagnostic is useful when teams disagree about metrics or readiness. A defined consulting project fits a scoped implementation, while ongoing support or a managed data team is justified only when reporting, governance and optimisation needs are genuinely continuous.
This decision guide is for founders, business owners, finance and operations leaders, marketing and ecommerce teams, data leaders, technology teams and procurement functions comparing business intelligence platforms, dashboard products and analytics support. It explains readiness, technical fit, cost, implementation, governance, ownership and the outcomes a professional engagement should leave behind.
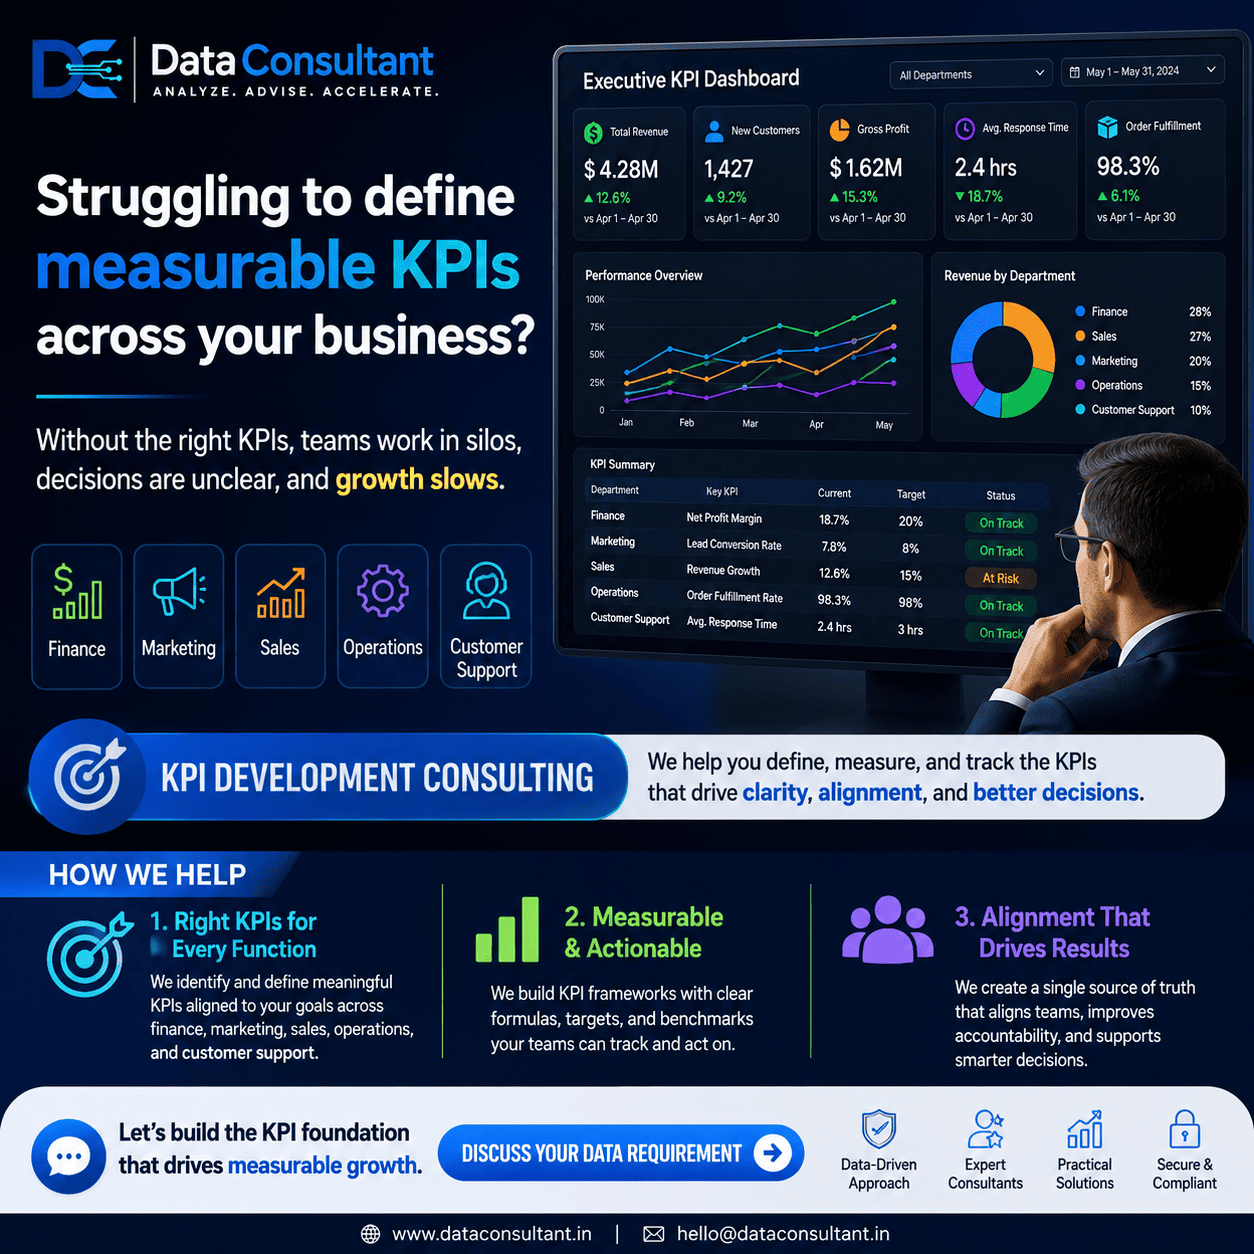
Quick Answer: Match the Tool to the Decision
The best data visualization tool is the one that reliably answers a defined business question for a known audience within your technical and governance constraints. For a small team with clean spreadsheet data, a familiar self-service product may be sufficient. For an organisation with multiple systems, controlled metrics, row-level security and executive reporting, the real requirement may include data engineering, semantic modelling, governance and adoption support.
Use a short diagnostic when report conflicts, data quality or tool requirements are unclear. Use a defined project when data sources, dashboards, milestones and acceptance criteria can be scoped. Choose ongoing support only when new use cases, release management, data-quality monitoring and user support create a recurring workload.
Do not hire a consultant before defining the business decision or operational problem. Equally, do not buy a tool merely to avoid that definition work: software cannot decide which revenue measure is authoritative, who owns customer data or whether a forecast is suitable for management action.
Key Takeaways
- Start with the decision: define the question, audience, action and frequency before comparing visualisation features.
- Test data readiness: dashboards depend on accessible sources, agreed definitions, sufficient quality and usable history.
- Retain internal ownership: business and data owners must approve KPIs, priorities, access and final acceptance.
- Scope deliverables: require requirements, models, dashboards, test evidence, documentation, training and handover where relevant.
- Build governance in: permissions, privacy, security, lineage and change control must apply to reports as well as source systems.
- Compare total cost: licences are only one part of modelling, integration, administration, support and adoption.
- Plan knowledge transfer: internal teams should be able to operate, explain and improve the solution after delivery.
Table of Contents
- Define the visualisation decision
- Check data and team readiness
- Compare tools and support models
- Set technical and governance needs
- Plan a controlled implementation
- Estimate cost and resources
- Measure decision value and adoption
- Apply the choice to real situations
- Decide where consulting adds value
- Summary
Define the Decision Before Comparing Tools
A useful visualisation brief describes the decision, not the requested chart. “Build a sales dashboard” is incomplete. “Help regional managers identify product, customer and channel variances each Monday, using agreed net-revenue and margin definitions” is testable.
Separate the business problem from the interface
Ask what action should change when a user sees the report. Executive reporting may require a concise narrative, controlled metrics and exception-based views. Operations teams may need near-real-time queues and drill-through. Analysts may need exploratory capability, reusable semantic models and governed self-service. Customer-facing embedded analytics introduces product performance, tenancy and accessibility requirements.
Document the audience, frequency, decisions, measures, dimensions, comparison periods, tolerances and required explanations. Where stakeholders use the same term differently, create a KPI dictionary before selecting visuals. A chart cannot resolve a disagreement about whether “active customer” means a purchase in 30, 90 or 365 days.
Decide whether the gap is software or capability
A tool is the likely answer when data is already available, metrics are agreed and the team mainly lacks required functionality such as secure distribution, mobile access, scheduled refresh or embedded reporting. Specialist support becomes more relevant when the organisation needs requirements discovery, source integration, data modelling, governance design, dashboard information architecture or an independent evaluation.
Check Data Readiness Before Dashboard Design
Data readiness usually determines effort more than visual design. Assess five areas: business clarity, data quality, access, technical structure and internal ownership. The environment does not need to be perfect, but known limitations must be visible and manageable.
- Business clarity: users agree the decision, measures and success criteria.
- Data quality: completeness, validity, consistency, timeliness and duplication are understood.
- Access: owners can authorise appropriate source, test and production access.
- Technical structure: keys, history, dimensions and refresh processes can support the required analysis.
- Ownership: named people approve definitions, prioritise changes and accept delivery.
The ISO/IEC 25012 data quality model provides a useful reference for defining data-quality characteristics. The aim is not to apply every formal concept to every dashboard; it is to avoid treating attractive visuals as evidence that the underlying data is fit for purpose.
Decision rule: when two trusted reports produce materially different answers, pause tool selection and run a focused diagnostic covering definitions, source mappings, transformations, lineage and ownership.
Compare Tools, Projects and Ongoing Support
The right choice depends on problem clarity, internal capability, continuity and the amount of change required around the tool. The table compares six realistic options.
| Option | Best fit | Expected output | Internal capability needed | Cost structure | Main risk |
|---|---|---|---|---|---|
| Internal team | Clear question, reliable data and limited scope | Reports, models and incremental improvements | Analysis, modelling, design and stakeholder time | Staff time and existing licences | Delivery loses priority or relies on one person |
| Software tool | Requirements are clear and the main gap is functionality | Configured workspace, connectors and reports | Administration, governance and report development | Licence, infrastructure and support | A feature-led purchase without adoption or ownership |
| Short data diagnostic | Reports conflict or readiness and scope are uncertain | Findings, KPI issues, options and prioritised roadmap | Stakeholder access and evidence provision | Fixed or time-based advisory fee | Recommendations stall without a decision owner |
| Defined consulting project | Scoped integration, modelling or dashboard delivery | Designs, pipelines, models, dashboards, tests and handover | Product owner, SMEs, technology and governance support | Milestone or time-and-materials project | Scope expands without acceptance criteria |
| Ongoing consultant support | Priorities and reporting needs change regularly | Backlog delivery, governance, optimisation and coaching | Regular prioritisation and operational ownership | Retainer or capacity-based fee | Dependency if capability is not transferred |
| Dedicated specialist or managed team | Substantial continuous workload across several disciplines | Predictable capacity for engineering, BI and governance | Executive sponsor and service-management cadence | Monthly managed capacity | Capacity is wasted when priorities are unclear |
A hybrid model is often practical: an external specialist clarifies architecture, metrics and the first release, while internal teams retain product ownership, business context and long-term operation.
Set Technical, Security and Governance Needs
A tool shortlist should be tested against the complete operating environment. Useful requirements include source compatibility, direct query or import modes, refresh frequency, semantic modelling, calculation logic, row-level security, identity integration, audit logging, version control, deployment workflows, accessibility, mobile use, export controls, embedding, performance and data residency.
Model once, explain consistently
Where many reports reuse the same measures, a governed semantic layer can reduce repeated logic and inconsistent calculations. Visualisations should expose definitions, filters, freshness and known limitations so users can interpret results responsibly. Official Power BI guidance documentation, for example, covers modelling, optimisation and lifecycle practices that affect the full reporting experience, not only visual formatting.
Protect sensitive data in every view
Apply least-privilege access, appropriate masking, secure distribution and controlled exports. Confirm whether a chart could expose personal, commercial or regulated information through labels, drill-through, small groups or downloaded detail. The OECD data governance resources provide broader context on responsible data access, sharing and control, while applicable laws and internal policies remain the direct requirements for your organisation.
For analytics that incorporate machine learning or AI-generated narratives, use risk-based review rather than assuming the visual layer makes the output reliable. The NIST AI Risk Management Framework can help teams structure governance, measurement and risk discussions.
Implement a Small, Testable Reporting Release
Start with one decision area, a manageable user group and representative data. A pilot should test the complete chain from source to interpretation: extraction, transformation, metric calculation, security, visual design, performance, distribution and user action.
Require implementation deliverables
- Discovery findings and prioritised use cases.
- Documented KPI definitions and acceptance criteria.
- Data-source inventory, lineage and quality issues.
- Architecture, integration and semantic-model designs.
- Prototype and production dashboards with accessibility considered.
- Test cases covering calculations, filters, security and refresh.
- Deployment, support and change-control procedures.
- User guidance, administrator documentation and knowledge transfer.
Plan releases around decisions rather than pages. A “management performance release” may include a small set of trusted measures, commentary prompts and exception views. Additional drill-through and automation can follow after users demonstrate that the first release is understood and used.
Do not begin predictive analytics or AI-generated executive commentary until historical data, definitions and evaluation methods are adequate. Advanced features can amplify weak assumptions as efficiently as they amplify good analysis.
Estimate Total Cost, Time and Resources
Total cost includes licences, infrastructure, connectors, data engineering, modelling, report development, security review, testing, training, administration and maintenance. A low licence price does not make a solution inexpensive when every source requires custom preparation or when business users depend on manual reconciliations.
A diagnostic may take a few weeks when stakeholders and evidence are available. A focused dashboard project may take several weeks to a few months. Enterprise programmes usually require phased delivery because platform configuration, data pipelines, metric governance, access approvals, testing and adoption must be coordinated. Timelines extend when source data is undocumented, ownership is unclear or production access is delayed.
Budget for internal participation
Business owners define decisions and accept outputs. Data owners approve use. Subject-matter experts validate calculations. Technology teams provide access and environments. Privacy, security and risk teams review controls. Procurement and legal teams confirm licensing, data processing and intellectual-property terms. Users participate in testing and adoption. A supplier proposal that assumes minimal internal involvement is unlikely to be realistic.
Measure Decision Quality, Trust and Adoption
Success is not the number of dashboards published. Measure whether users can reach the intended decision with appropriate speed, confidence and context, and whether the organisation can operate the solution safely.
- Usage by intended roles and frequency of repeat use.
- Time required to prepare, review and explain recurring reports.
- Reconciliation exceptions and unresolved KPI disputes.
- Accuracy of calculations against approved definitions.
- Data freshness, failed refreshes and performance.
- User comprehension of filters, assumptions and limitations.
- Adoption of governed reports instead of uncontrolled alternatives.
- Internal ability to maintain models, dashboards and access controls.
Agree baselines before implementation. Where business results change, test whether the visualisation contributed alongside pricing, process, staffing, market conditions and management action. Do not attribute revenue, savings or forecast improvement to a dashboard without evidence.
Practical Data Visualization Tool Decisions
Ecommerce reports show different revenue
An ecommerce business wants a new dashboard because finance and marketing report different revenue. The mistaken assumption is that a more advanced visualisation tool will reconcile the numbers. The actual problem is inconsistent treatment of refunds, tax, shipping and order dates. A short diagnostic is the better first step. Likely deliverables include an agreed KPI dictionary, source mapping, reconciliation logic, data-quality backlog and a prototype executive view. Finance, marketing, ecommerce operations and data owners must participate.
Professional services rely on spreadsheets
A professional-services company compiles utilisation and margin reports through linked spreadsheets. Buying a BI licence alone will not remove manual risk. A defined project may be appropriate to standardise time, project and finance data; create controlled transformations; design a semantic model; automate management reporting; document review controls; and train internal owners. The business must provide subject-matter experts who understand project accounting and exceptions.
Locations disagree about KPI definitions
A multi-location operator wants a single executive scorecard, but each region calculates service levels and productivity differently. The real requirement is metric governance and stakeholder alignment before visual design. A diagnostic followed by a phased project can produce approved definitions, ownership, comparability rules, a prioritised dashboard and a process for controlled changes. Regional leaders must accept where legitimate differences remain visible.
A startup wants predictive dashboards
A startup wants predictive analytics before product events and customer identifiers are collected consistently. The better decision is to improve instrumentation, retention definitions and historical coverage, then launch a small descriptive reporting release. A readiness assessment can identify what to collect, how to govern it and when modelling becomes feasible. Advanced analytics should be delayed rather than presented as certain or immediately valuable.
Use Consulting Where It Reduces Decision Risk
External support is most useful when the organisation needs an independent diagnostic, requirements clarification, KPI alignment, data-quality assessment, architecture review, source integration, semantic modelling, dashboard planning, governance design or implementation support. It is less useful when the task is small, well defined and fully within the capacity of an available internal team.
DataConsultant can support a focused data assessment, a defined analytics and dashboard project, necessary data engineering, or ongoing managed data support. The engagement should be limited to the actual problem, with clear deliverables, acceptance criteria, documentation and knowledge transfer.
Summary
Choose data visualization tools only after clarifying the decision, audience, measures, data sources and ownership. Internal staff may be sufficient when the work is limited, data is reliable and the required skills are available. A software purchase may be sufficient when processes and metrics are already clear and the principal gap is functionality.
Use a short diagnostic when reports conflict, data quality is uncertain or technology discussions have started before requirements are agreed. Use a defined project when integration, modelling, governance, dashboard delivery, testing and handover can be scoped. Ongoing support or a managed team fits recurring multi-department needs that do not yet justify a complete internal capability.
Before committing, validate business goals, data quality, access, privacy, security, governance, internal ownership, scope, budget and timeline. Require practical documentation, quality assurance, knowledge transfer and a clear handover so the organisation can trust and operate what is delivered.
FAQs on Data Visualization Tools
What are data visualization tools?
Data visualization tools turn data into charts, dashboards, maps and interactive reports so people can interpret patterns, compare performance and make decisions. The tool is only one part of the solution: reliable source data, agreed KPI definitions, suitable data modelling, access controls and a clear audience are also required. Before selecting a product, define the decisions the visualisation must support and test the tool with representative data.
How should a business choose between data visualization tools?
Choose by use case, users, data sources, governance requirements, deployment model, skills and total operating cost. A finance team may prioritise controlled reporting and auditability, while a product team may need exploratory analysis and embedded analytics. Compare shortlisted tools through a small proof of concept using real metrics, realistic data volumes and agreed acceptance criteria rather than relying on feature demonstrations.
Can a data visualization tool solve poor data quality?
No. A visualisation tool may reveal missing, duplicated or inconsistent data, but it does not automatically correct source-system processes, ownership or definitions. Where dashboards disagree, begin with data profiling, KPI alignment and lineage analysis. A short data diagnostic is often more useful than immediately rebuilding reports.
Should we use internal staff or hire a data consultant?
Use internal staff when the business question is clear, data is accessible and reasonably reliable, and the team has enough analytical, technical and design capability. Consider a data consultant when requirements are disputed, several systems must be integrated, governance is unclear, or a time-limited specialist project needs architecture, modelling, dashboard design, documentation and handover. Retain an accountable internal owner in either model.
What information should we prepare before evaluating tools?
Prepare the business decisions to be supported, user groups, current reports, KPI definitions, data-source inventory, data volumes, refresh needs, access roles, privacy classifications, security constraints, integration requirements and examples of recurring reporting problems. Also identify the executive sponsor, business owner, data owner, technical lead and people who will test outputs. Gaps can be recorded rather than hidden.
How much do data visualization tools and consulting cost?
Cost depends on licences, user numbers, deployment, connectors, data-platform work, modelling, report complexity, security, training and ongoing administration. Consulting cost also depends on whether the work is a short diagnostic, a defined implementation project, continuing advisory support or a managed team. Compare total cost of ownership, including internal stakeholder time and maintenance, rather than licence price alone.
How long does a data visualisation project take?
A focused diagnostic or proof of concept may take a few weeks when access and requirements are ready. A defined dashboard project may take several weeks to a few months, while enterprise roll-outs can take longer because data engineering, semantic modelling, security review, testing, change management and training must be coordinated. Use phased milestones and acceptance criteria instead of treating the first release as final.
What deliverables should a data consultant provide?
Deliverables should match the problem and may include discovery findings, a prioritised use-case backlog, KPI dictionary, data-quality assessment, source-to-report lineage, architecture or semantic-model design, tool evaluation, prototype dashboards, production reports, test evidence, governance controls, documentation, training and a handover plan. Ownership of code, models, dashboards and documentation should be explicit in the contract.
When is ongoing analytics support appropriate?
Ongoing support is appropriate when reporting priorities change frequently, several departments need regular specialist input, data quality requires sustained attention, or the organisation lacks enough internal capacity to manage releases and adoption. A one-off project is usually better when the scope is stable and internal teams can own maintenance. Review the arrangement periodically to prevent unnecessary dependency.
Need a Data Visualisation Diagnostic?
Share the decisions you need to support, current reports, data sources, users, security constraints and ownership gaps. DataConsultant can help determine whether an internal improvement, tool configuration, short diagnostic, defined analytics project or ongoing specialist support is the appropriate next step.
Discuss your requirementAt DataConsultant.in, we help organisations turn data and AI priorities into governed, reliable, and practical business capability.