
Data Analyst Roadmap: From Foundations to Job Readiness
A practical data analyst roadmap starts with business questions, data fundamentals and SQL before expanding into dashboards, programming and advanced analysis. The central decision is not which tool to learn first; it is which sequence will help you turn raw data into a defensible answer that another person can use. Begin by learning to frame a question, inspect a dataset, clean obvious quality issues, calculate and compare metrics, and explain what the evidence does and does not support. Then add tools that make those tasks faster or more repeatable.
The main caution is to avoid a technology-first plan. Collecting certificates in Excel, SQL, Power BI, Tableau, Python and AI without completing real analyses can create breadth without job readiness. A stronger roadmap uses small projects as checkpoints: each new skill should help you answer a more realistic question, work with more difficult data or communicate more clearly.
This guide is for students, career changers, early-career professionals and organisations building analyst capability. It explains what to learn, what to practise, how to sequence tools, how to build evidence of skill, and how to decide when you are ready for interviews or more advanced analytics work.
Quick Answer: Learn the Workflow Before the Tool Stack
A job-focused roadmap has five layers: business understanding, spreadsheet and data-quality fundamentals, SQL, visual analysis and communication, then programming or advanced methods where useful. Learn each layer through tasks rather than isolated features. For example, do not merely memorise JOIN syntax; use joins to answer a customer, sales or operations question and verify that row counts still make sense.
If you are starting from zero, prioritise spreadsheets and SQL first, then one BI platform such as Power BI. Add Python when you need automation, reproducible analysis, larger datasets or richer statistical work. Use AI tools to accelerate learning and checking, but validate generated formulas, code and interpretations yourself.
Decision rule: move to the next stage when you can complete a realistic task without copying a tutorial step by step and can explain your assumptions, checks and result in plain language.
Key Takeaways
- Start with decisions, not software: a data analyst is valuable because they turn questions into evidence and recommendations.
- Learn SQL deeply enough to work across tables: filtering, aggregation, joins, dates, null handling and window functions are high-value skills.
- Choose one BI tool: build competence in modelling, measures, visuals and stakeholder-facing reports before collecting multiple dashboard tools.
- Add Python with a purpose: use it for repeatability, automation, larger datasets and analysis that spreadsheets or BI tools handle poorly.
- Build projects continuously: two to four well-explained projects are more persuasive than a long list of courses.
- Practise communication and controls: data quality, privacy, access, metric definitions and uncertainty are part of analyst work.
- Apply before you feel complete: start job applications when you can solve an unfamiliar case end to end and explain your reasoning.
Table of Contents
- Understand the analyst job
- Build foundations
- Sequence the tool stack
- Develop business and data judgement
- Practise through projects
- Plan time and learning resources
- Measure job readiness
- Follow practical examples
- Choose structured support
- Summary
Understand What a Data Analyst Actually Does
A data analyst turns an ambiguous business question into a measurable problem, obtains and checks relevant data, analyses it, and communicates a conclusion that supports action. Tools matter, but they sit inside that workflow. This is why a roadmap built only around software courses often feels fragmented.
Microsoft describes the Power BI data analyst role as working with business stakeholders to identify requirements and with data professionals to acquire data, then preparing, modelling, visualising and analysing it. That is a useful reminder that stakeholder interpretation and data preparation are not secondary skills. See the Microsoft Power BI Data Analyst role overview.
Learn the analytical loop
- Clarify the decision, audience and metric.
- Locate the right data and understand its grain.
- Clean, transform and reconcile obvious issues.
- Analyse patterns and test alternative explanations.
- Visualise only what helps the reader understand the answer.
- State assumptions, limitations and recommended next action.
Practise this loop from the beginning. A simple spreadsheet analysis completed end to end is more useful than an advanced tool demonstration that has no decision attached to it.
Build Foundations Before Advanced Analytics
Foundational ability is sufficient when you can work confidently with tables, percentages, dates, categories and simple summaries while spotting data that looks incomplete or inconsistent. You do not need advanced mathematics before you begin, but you should be comfortable reasoning about numbers and asking whether a metric is defined correctly.
Stage 1: spreadsheets and data quality
Use Excel or another spreadsheet to learn sorting, filtering, lookups, conditional logic, text and date handling, pivot tables, basic charts and error checks. The deeper lesson is not formula memorisation; it is learning how records, columns and calculations behave.
Stage 2: practical statistics
Learn mean, median, percentiles, variation, distributions, sampling, confidence, correlation and the difference between association and causation. These ideas help you avoid overclaiming. You should be able to explain why an average can hide important variation and why a change in a dashboard does not automatically prove what caused it.
Google's current data analytics curriculum similarly emphasises asking questions, preparing and processing data, analysis, visualisation and a capstone case study. Its overview is a useful example of a workflow-based learning sequence: Google Data Analytics Certificate.
Sequence the Data Analyst Tool Stack
The best sequence is the one that builds transferable analytical ability while limiting tool switching. For most beginners, SQL and one BI tool deserve more depth than collecting several programming languages or visualisation platforms at once.
| Stage | Core skills | Evidence to produce | Move on when |
|---|---|---|---|
| 1. Foundations | Spreadsheets, data types, cleaning, basic statistics | Cleaned workbook and short insight summary | You can explain checks and calculations |
| 2. SQL | SELECT, filters, GROUP BY, joins, dates, nulls, CTEs, windows | Queries answering a multi-table business question | You can debug unexpected row counts |
| 3. BI | Power Query, modelling, measures, visual design, dashboard logic | Decision-focused dashboard with metric definitions | You can defend each visual and measure |
| 4. Programming | Python or R, dataframes, files, notebooks, repeatable analysis | Reproducible analysis with documented steps | Code saves time or enables new analysis |
| 5. Advanced depth | Experimentation, forecasting, advanced statistics, domain methods | Role-specific project | The target role genuinely requires it |
Treat this as a sequence, not a rigid syllabus. A finance analyst may need stronger spreadsheets and modelling; a product analyst may need more SQL and experimentation; an operations analyst may benefit from automation earlier.
Make SQL a core skill
Use a relational database for hands-on practice. The official PostgreSQL SQL tutorial covers querying, joins and aggregate functions, then points toward advanced features such as window functions. Practise by writing queries from a question rather than by copying syntax examples.
Choose one BI platform
Power BI, Tableau and similar platforms differ in interface, but the durable skills are data preparation, modelling, metric logic, visual selection and stakeholder communication. Microsoft's official Power BI data preparation learning path is useful if Power BI matches your target roles.
Add Python when it solves a problem
Python is valuable for repeatable cleaning, file processing, automation, statistical analysis and larger workflows. Learn variables, lists and dictionaries, functions, file handling, modules and then data libraries. The official Python tutorial is a reliable language reference, although complete programming beginners may need a gentler introductory resource alongside it.
Develop Business and Data Judgement
Technical competence becomes useful when you can decide what to measure and recognise when the available data cannot answer the question safely. Build domain knowledge in the area where you want to work: finance, marketing, ecommerce, risk, operations, product or another function.
Treat metric definitions as part of analysis
If “active customer”, “revenue”, “conversion” or “on-time delivery” has multiple definitions, the analyst should surface the ambiguity before building a polished dashboard. Record the definition, time period, exclusions, source and owner where possible.
Understand governance basics
Learn the practical meaning of least-privilege access, personal and sensitive data, retention, approved data sources and safe sharing. Do not copy production data into personal tools simply because it makes practice easier. In a workplace, follow organisational policies and involve data owners, privacy, security or risk teams when the use case requires it.
Also develop healthy scepticism. Check duplicates, missing values, units, date ranges, joins, denominator choices and whether a chart exaggerates differences. A strong analyst can explain where the data came from and which quality issues could change the conclusion.
Build Projects That Prove End-to-End Skill
Projects should demonstrate a complete reasoning chain, not just a final dashboard. Two to four strong projects are enough if they show different problems and clearly explain the work. Use public, synthetic or appropriately licensed data and keep a short README or project note for each analysis.
- Business question: what decision or problem are you analysing?
- Data: what tables or files are used, and what are their limitations?
- Method: what cleaning, joins, calculations or statistical methods were applied?
- Checks: how did you test row counts, missing data and metric logic?
- Result: what did you find, and how confident are you?
- Recommendation: what should the stakeholder do or investigate next?
A useful portfolio mixes formats. One project might be SQL-heavy, another a dashboard, and another a Python notebook. Avoid producing three projects that are visually different but analytically identical.
Plan Time and Learning Resources Realistically
Do not judge progress only by months. Someone with finance or operations experience may already have strong business judgement but need SQL; a computer-science learner may code comfortably but need stakeholder communication and metric design. Build a weekly plan around output.
A practical study cycle is to spend part of the week learning a concept, part applying it without a tutorial, and part explaining the result. Paid courses can add structure and feedback, but free official documentation, public datasets and self-designed projects can cover substantial technical ground. The important resource is consistent practice time and access to problems that force you to make decisions.
Avoid the course treadmill: if you finish a module but cannot reproduce the task with a different dataset, repeat the skill through practice before buying another course or adding another tool.
Measure Readiness by Evidence, Not Completion
You are becoming job-ready when you can solve unfamiliar problems with less scaffolding. Test yourself with timed cases and blank-page exercises. Given a dataset, can you decide what to inspect first? Can you write a query without searching for every clause? Can you notice that a join multiplied rows? Can you explain why a KPI moved and what evidence is still missing?
Use five checkpoints: technical execution, analytical reasoning, data-quality checks, communication and business relevance. Ask another person to review your project without hearing your explanation first. If the purpose, logic and recommendation are not understandable from the work itself, improve the narrative.
Interview readiness also means speaking clearly about trade-offs. Be prepared to explain why you chose a median rather than a mean, why a line chart is more useful than a pie chart, how you validated a query, what you would do with more time, and what conclusion you deliberately did not make because the data was insufficient.
Three Practical Roadmap Examples
Career changer from finance
A finance professional may already understand reconciliations, variance analysis and stakeholder questions. Their shortest route may be advanced spreadsheet practice, SQL, Power BI modelling and a portfolio project using finance-style data. Python can come later unless automation or forecasting is central to the target role.
Graduate with programming experience
A graduate who knows Python may need less coding study and more practice with SQL, business metrics, dashboard design and concise recommendations. A strong project would begin with an operational question and end with a decision memo or dashboard, not merely a notebook full of code.
Working analyst moving beyond reporting
An analyst who already produces recurring reports may focus on deeper SQL, reusable data models, statistical reasoning and automation. Their project evidence should show reduced manual work, better metric consistency or a more rigorous analytical method, while avoiding claims that cannot be supported by measured results.
When Structured Learning or Specialist Support Helps
Self-directed study is sufficient when you can define a sequence, find credible resources, create projects and obtain useful feedback. Structured support becomes more valuable when you repeatedly stall, need role-specific practice, or an organisation must build consistent analyst capability across multiple people.
For organisations, the problem may be broader than training: inconsistent KPI definitions, poor data access, weak quality controls or unclear ownership can limit what analysts are able to do. In those cases, capability building should connect learning to governed datasets and real work. DataConsultant.in's Academy Service can support organisations that need a structured data and analytics capability programme rather than isolated course consumption.
Frequently Asked Questions
What is the best data analyst roadmap for a beginner?
Start with spreadsheet fluency and basic statistics, then learn SQL well enough to query and combine tables, build one business intelligence tool to reporting level, and add Python or R when the work benefits from repeatable analysis. Build projects throughout the journey rather than waiting until every tool is learned.
Do I need Python to become a data analyst?
Not always. Many entry-level analyst roles can be approached with strong spreadsheet, SQL and business intelligence skills. Python becomes more useful when datasets are larger, analysis needs to be repeated, files must be automated, or statistical work goes beyond what is comfortable in spreadsheets or BI tools.
How much SQL should a data analyst know?
A job-ready analyst should be comfortable selecting and filtering data, grouping and aggregating, joining multiple tables, using conditional logic, handling dates and nulls, and reading nested queries or common table expressions. Window functions are a valuable next step because they support ranking, running totals and comparative analysis.
Should I learn Excel or Power BI first?
Learn enough spreadsheet work first to clean data, use formulas, summarise tables and inspect errors. Then add Power BI or another BI tool so you can model data, define measures and present repeatable reports. The goal is not to choose one tool permanently; it is to understand the analytical workflow behind both.
How long does a data analyst roadmap take?
There is no universal duration because prior experience, study time and target roles differ. A better plan is to progress by evidence: move forward when you can complete realistic tasks without following a tutorial line by line. Track SQL exercises, completed analyses, portfolio projects and interview-style explanations rather than calendar time alone.
What projects should be in a data analyst portfolio?
Use two to four projects that show different abilities: cleaning a messy dataset, querying relational data with SQL, building a decision-focused dashboard, and explaining an analysis with recommendations. Each project should state the business question, data limitations, method, result and what you would do next with better data.
Do data analysts need statistics?
Yes, but most entry-level analysts need practical statistical reasoning more than advanced mathematics. Focus on distributions, averages and variability, sampling, correlation versus causation, confidence and uncertainty, basic hypothesis testing, and choosing a metric that matches the business question.
How should AI tools fit into a data analyst roadmap?
Use AI as an accelerator after you understand the underlying task. It can help explain code, draft queries, suggest checks or summarise patterns, but you still need to validate logic, inspect source data, protect sensitive information and explain how the result was produced. AI should not replace analytical judgement or evidence review.
When is a course or data academy useful for a data analyst roadmap?
Structured learning is useful when you need sequencing, practice datasets, feedback, accountability or role-specific exercises. It is less valuable when it becomes passive content consumption. Choose programmes that require hands-on work, portfolio evidence and explanation of business decisions rather than completion badges alone.
How do I know when I am ready to apply for data analyst jobs?
You are ready to start applying when you can take an unfamiliar dataset, clarify the question, clean and query the data, produce a useful visual or table, explain assumptions and limitations, and communicate a recommendation. You do not need to master every tool listed in every vacancy before applying.
Summary
A strong data analyst roadmap is a sequence of increasingly realistic decisions. Start with spreadsheet and data-quality fundamentals, build SQL depth, learn one BI platform, add practical statistics and communication, then introduce Python or advanced methods when they solve a genuine analytical problem. Keep projects running alongside learning so every stage produces evidence rather than just course completion.
Internal study and software are sufficient when the goal is clear, data is accessible and the learner can obtain feedback. A structured course or short diagnostic helps when sequencing or readiness is unclear. A defined capability project is justified when an organisation must align roles, governed data, tools and practical exercises, while ongoing support is relevant only when skills, use cases and governance requirements continue to evolve.
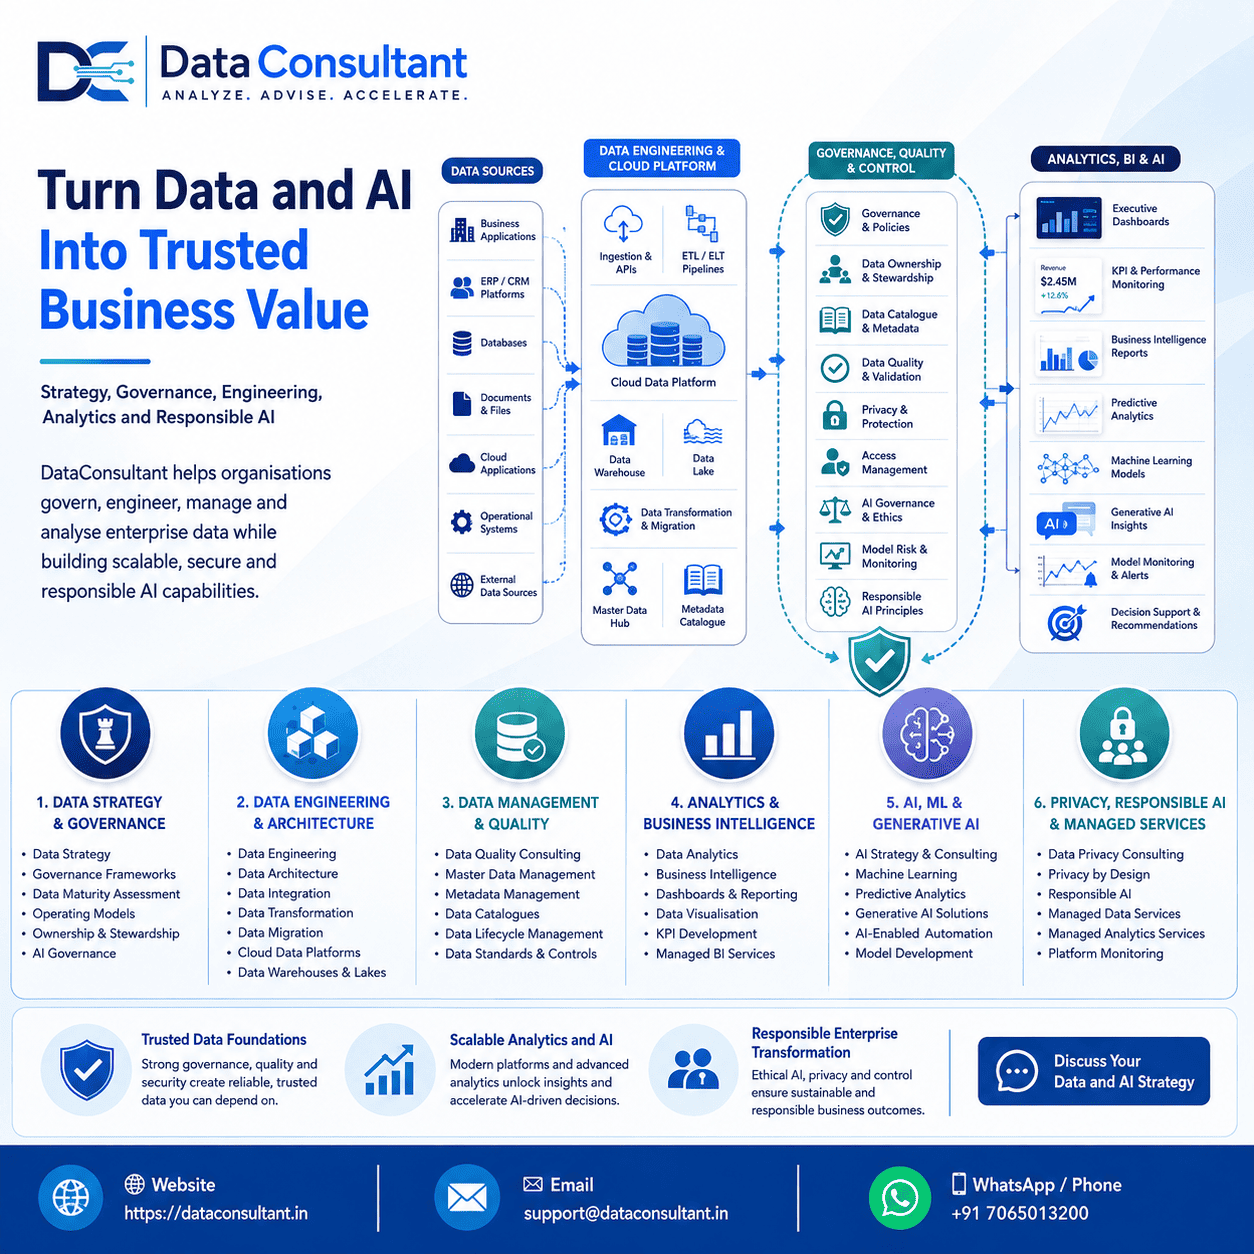
Before investing further, validate the goal, data quality, access, governance and internal ownership, then choose the smallest next step that creates useful evidence. At DataConsultant.in, we help organisations turn data and AI priorities into governed, reliable, and practical business capability.